Welcome
Welcome to Seasonal Tokens:
A tool for building wealth, a financial innovation, an accessible investment option, a risk management tool, and a long-term investment strategy.
Seasonal Tokens is the first cryptocurrency system in the world with built in seasonality in their relative prices.
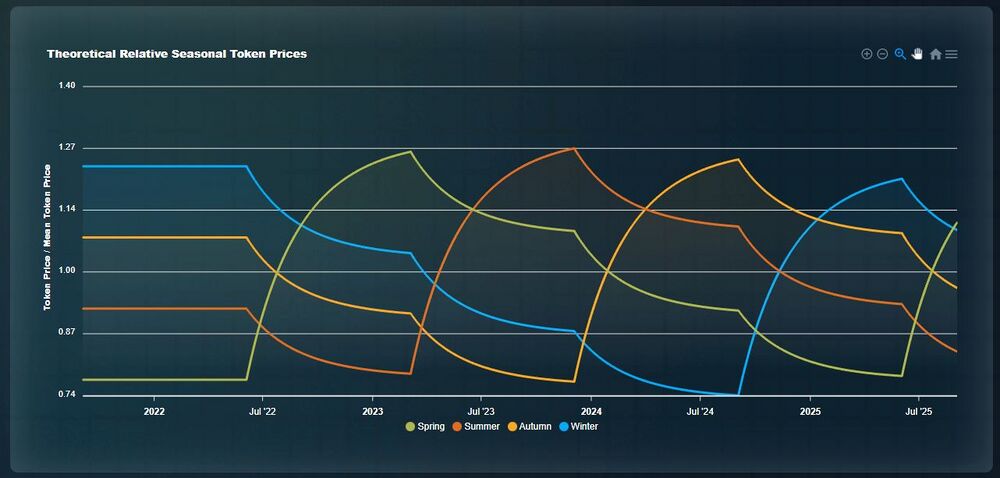
The essence of the system can be appreciated in one picture:
Traders can profit from the predictable price changes. There is a winning trading strategy in the system:
- Buy the cheapest tokens.
- Wait until it becomes the most expensive of the four.
- Trade them for the cheapest token.
- Repeat.
This brings the power of compounding returns to your portfolio, and the results are amazing. You can see it for yourself using our seasonal trading simulator.
Traders can use these clear, transparent, and public signals to decide how and when to buy and sell the tokens. This is an innovative, ethical and fair approach to cryptocurrency trading.
Warning! A token is said to be "in season" when it is produced at the fastest rate, and it goes out of season when its mining supply is cut in half. These Token seasons last nine months each, and do not coincide with the actual seasons in nature lasting 4 months.
Relative Prices Chart Explained
Understanding Seasonal Tokens equals: Understanding the Normalized Relative Price Graph This page explains the dimensionless variable used to analyze the relative prices of the four tokens.
Check out this video explaining the Relative Tokens Price Chart.
Proof of Concept:
The picture above represents a theoretical model for the response of the relative prices to the changes in mining supply.
It extrapolates into the future assuming the relative prices will behave as they did during the first 20 months of the project.
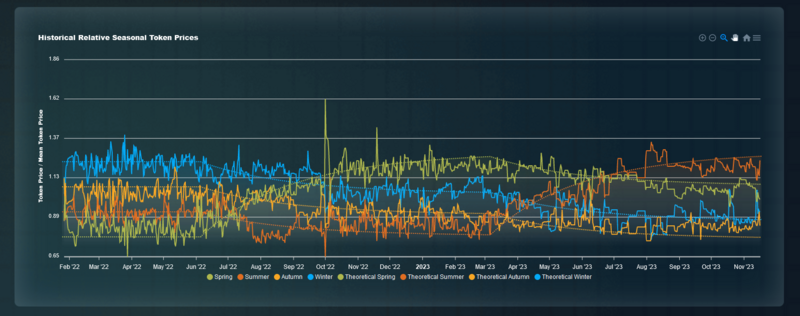
The next chart shows the historical relative prices of the four tokens. Notice that despite random fluctuations the real prices fluctuate around a well-defined pattern. (Dotted lines in the chart)
In particular, notice that on June 2022 the rate of production of Spring token was cut in half, creating upward pressure on its price, and five months later Spring was the most expensive of the four tokens.
In March 2023 the rate of supply of Summer tokens was cut in half, and you can see that its price is rising relative to the other tokens.
Not only this proves that the Seasonal Tokens system is working as designed, but it is also a technological accomplishment because it proves that mining supply does affect the price.
It is hard to see this periodical signal in other proof of work cryptocurrencies because the fluctuations in the dollar prices blur the effects of the halving of mining supply.
By focusing on the relative prices of the four tokens, the effects of fluctuations in the dollar prices are factored out.
Do you Want to Be Part of This Financial Innovation in Web3 Technology?
Read our Due Diligence article .
Chat with team members of the project. We have a friendly community of people who trust this project and are happy to clear out any doubts or questions you may have. And help you to find an easy entry point according to your special needs.
How to Guides and Tutorials: this is where you find step by step instructions on how to operate all features in Seasonal Tokens, how to buy tokens, do seasonal trading, mine tokens, and farm tokens to earn passive income providing liquidity to the markets.
If you are new to crypto, or want to learn more about Web3 technology, these tutorials can help you a lot with real world examples, using Seasonal Tokens to illustrate the potential of decentralized finance.
And off course: Read the white paper!
Don't have time for reading? Watch the video version of the documentation
No time at all? OK. Try this: DYOR in less than 60 seconds Playlist


