Relative Prices
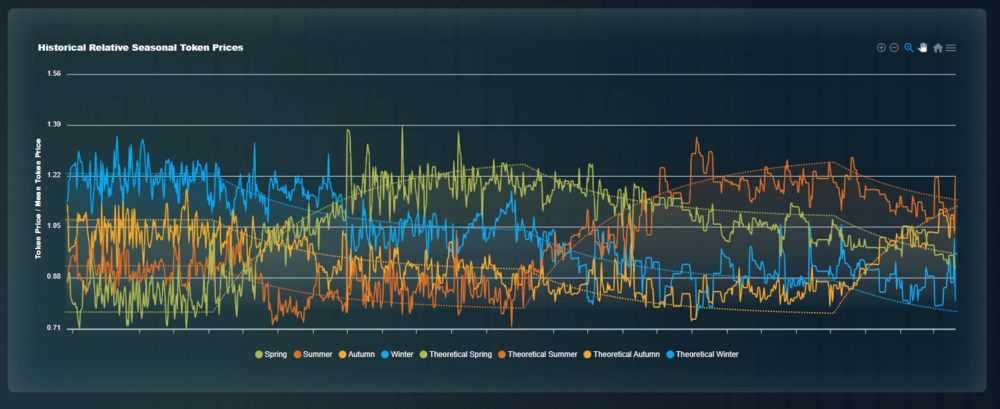
Historical Relative Price (Normalized Chart).
This graph represents the Relative Prices of the four tokens.
On the vertical axis, we have the token’s price divided by the average value of the four token's prices.
Where the average price is given by the sum of four token prices divided by four.
This dimensionless variable is equal to:
* 1 if the tokens price is equal to the average value.
* Less than 1 if the token’s price is lower than the average price.
* Greater than 1 if the token’s price is above the average price.
This way of presenting the price data is independent of external factors affecting all four tokens' prices. In particular, this chart is independent of the dollar prices of the tokens.
Any change in the price of the tokens due to external factors would affect the numerator and denominator of this fraction in the same proportion. Canceling out its effect on this graph.
This way of presenting the price data concentrates only on changes in the relative value of the tokens. Leaving out the effects of external factors affecting all token prices in the same way.
Traders profit from oscillations in the relative prices of the four tokens. And those are independent of the dollar price of the tokens.
Note
If all token's prices are affected by the same factor:
Then the new average will be the old average multiplied by the same factor.


