TradingView: Difference between revisions
Jump to navigation
Jump to search
No edit summary |
No edit summary |
||
| Line 7: | Line 7: | ||
=Comparing price Data= | =Comparing price Data= | ||
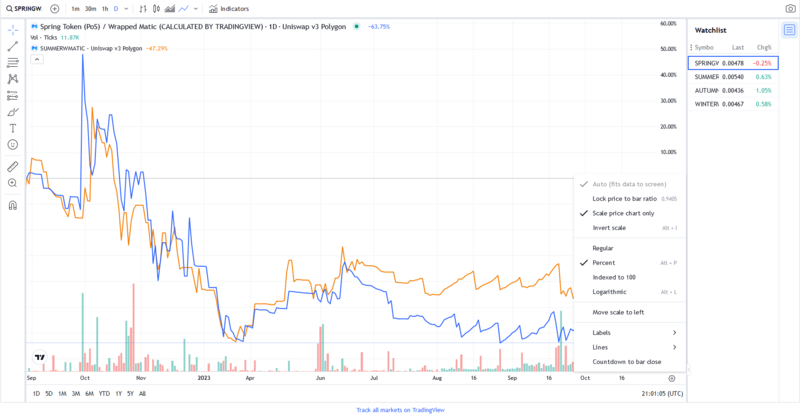
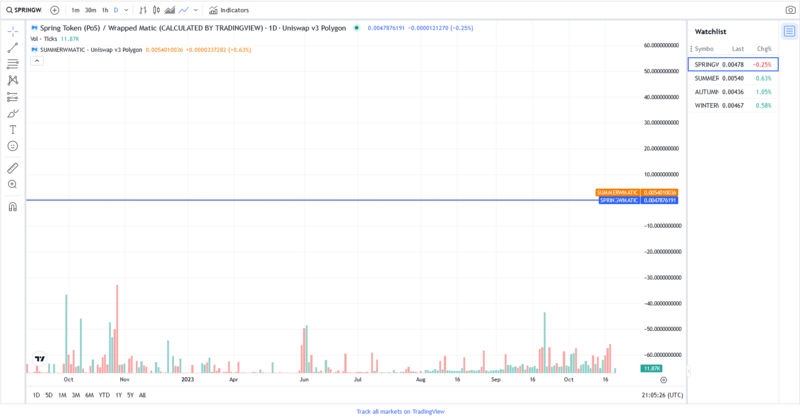
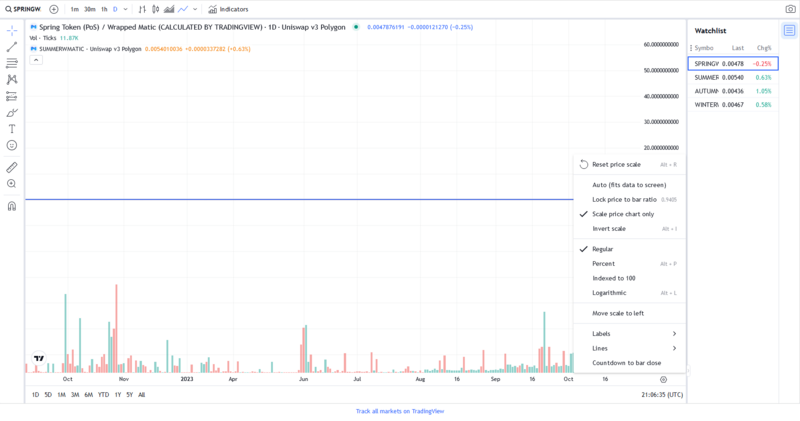
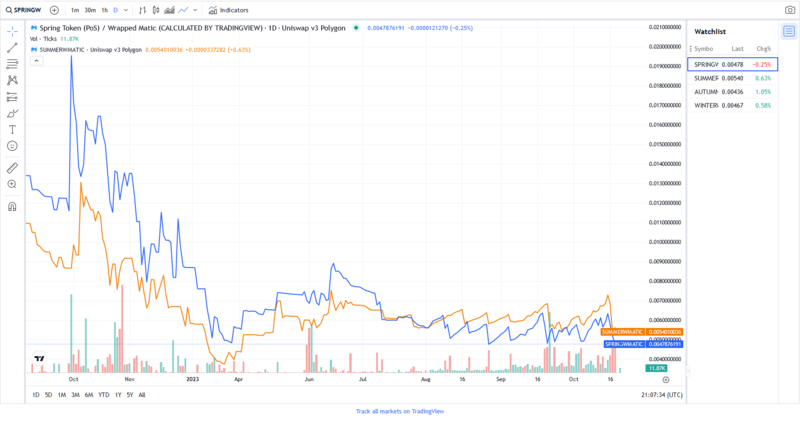
It is possible to display more than one token on the price chart. | It is possible to display more than one token on the price chart. However when you load another price graph they are not aligned properly, | ||
so we will explain how to fix this problem. | |||
[[File:01comparesymbol.png | | [[File:01comparesymbol.png |800px]] | ||
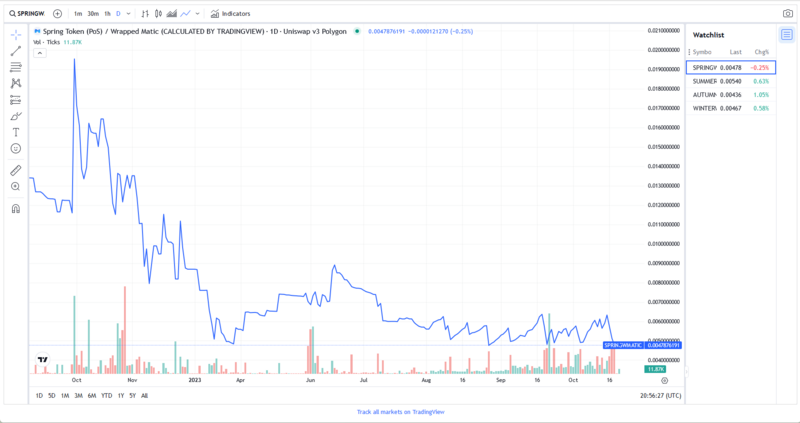
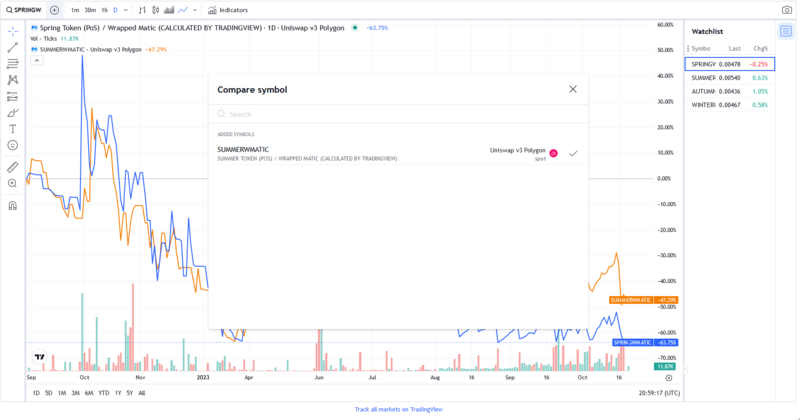
You can compare more than one price graphs by clicking on the plus sign at the top left corner of the chart. Select Compare Symbol. | |||
[[File:02comparesymbol.png |800px]] | |||
[[File:03comparesymbol.png |800px]] | |||
[[File:04comparesymbol.png |800px]] | |||
[[File:05comparesymbol.png |800px]] | |||
[[File:06comparesymbol.png |800px]] | |||
Revision as of 23:33, 20 October 2023
The following links display the updated price charts to help traders to profit from short time fluctuations in price. As opposed to the long term price fluctuations caused by the halving of mining supply.
Comparing price Data
It is possible to display more than one token on the price chart. However when you load another price graph they are not aligned properly, so we will explain how to fix this problem.
You can compare more than one price graphs by clicking on the plus sign at the top left corner of the chart. Select Compare Symbol.
