TradingView
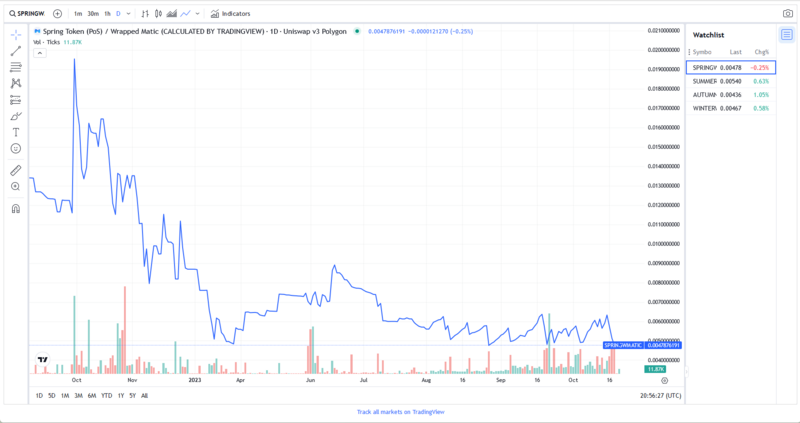
The following links display the updated price charts to help traders to profit from short time fluctuations in price. As opposed to the long term price fluctuations caused by the halving of mining supply.
Comparing price Data
It is possible to display more than one token on the price chart. However when you load another price graph they are not aligned and in the same scale, so we will explain how to fix this problem.
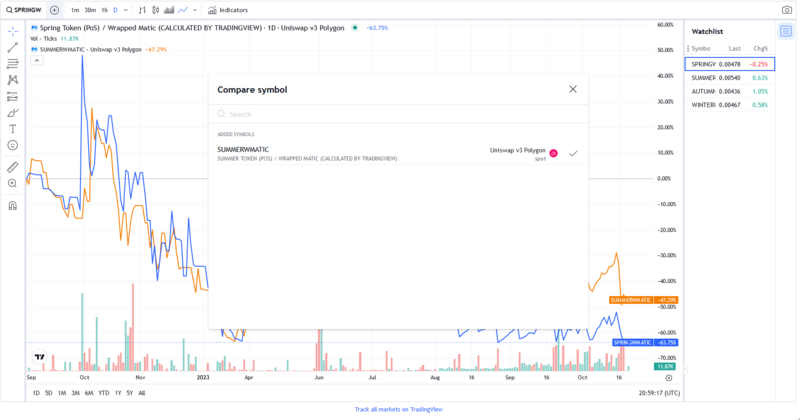
You can compare more than one price graphs by clicking on the plus sign at the top left corner of the chart. Select Compare Symbol. Trading view pairs are given in Wrapped Ether and Wrapped Matic. For Seasonal Tokens the names of the relevant token Symbols are:
In Ethereum:
- SPRINGWETH
- SUMMERWETH
- AUTUMNWETH
- WINTERWETH
In Polygon:
- SPRINGWMATIC
- SUMMERWMATIC
- AUTUMNWMATIC
- WINTERWMATIC
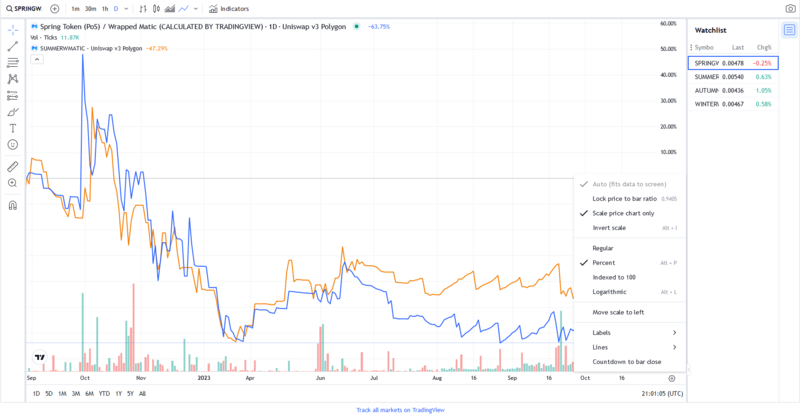
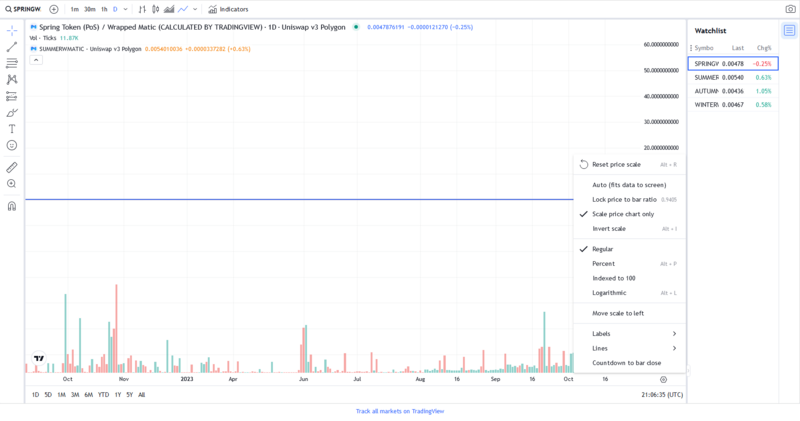
Then click on the icon at the lower right corner to display more options. Select Lock Price to Bar ratio.
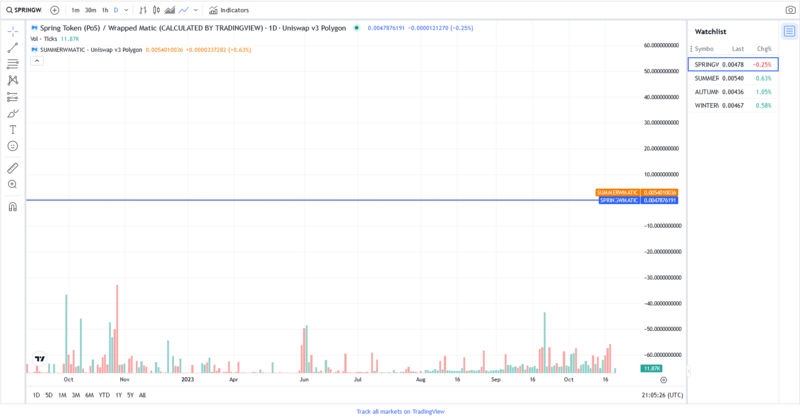
And the graphs will collapse into a single line. Then deselect the Lock Price to Bar ratio again.
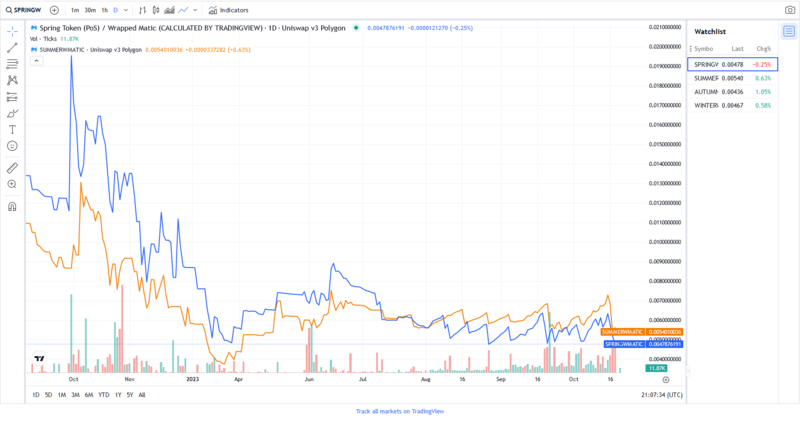
The graphs are still collapsed into a single line. Select Reset price scale
Now the graphs are aligned and set to the same scale. Repeat the same procedure when you add more tokens to compare.
