Brochure
BTC halving
Key observation in crypto: BTC halving introduces seasonality
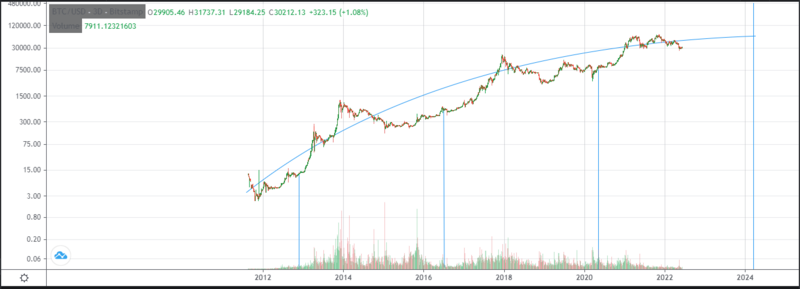
A key observation in cryptocurrency is that the Bitcoin halving of mining supply every 210.000 blocks has introduced a periodic behavior in cryptocurrency markets.
The following chart shows the historical Bitcoin's price. The blue vertical lines mark the dates when the mining supply of bitcoin was cut in half.
Bitcoin Halvings
| date |
Reward change in BTC
|
| 11/28/2012 |
50 to 25
|
| 07/09/2016 |
25 to 12.5
|
| 05/11/2020 |
12.5 to 6.25
|
| 04/19/2024 |
6.25 to 3.125
|
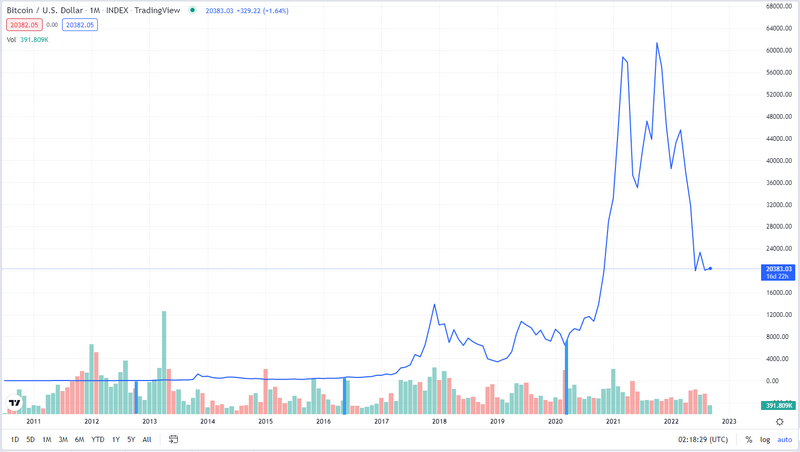
As you can appreciate, there is nothing particularly enlightening about this graph. It is hard to see the effect of the halving of the mining supply. The price changes are so large that the information is lost in the details of price fluctuations.
Analysis of the Log(Price) chart. Bull and Bear markets.
If we look at the graph on a logarithmic scale, we can concentrate on the order of magnitude changes, paying less attention to the random fluctuations in the price. Then a pattern emerges:

Every 4 years on average, the mining supply is cut in half. Months after the halving of the mining supply a bull market sends the Bitcoin price to all-time highs, this bull market sends the price way above its cost of production and the whole thing ends up with a price bubble leading to a bear market that may last for years until the next halving occurs.
As the Bitcoin price skyrockets, people starts looking for alternative investments leading to the so called "Altcoin Season", where other major cryptocurrencies experiment a rise in price due to the Bitcoin bull market.
Comment on long Bear markets and ST solution
QR with live chart for technical analysis
What Problem does it Solve?
The long Bear markets.
Miners, Farmers and Traders cooperate in the creation of the Asset
A low risk way of producing Proof of Work cryptocurrency
Designed for Investment
BTC was designed to be money.
Ethereum is a Decentralized Virtual Computer
Seasonal Tokens is an investment instrument to mitigate risk
To allow participation of many actors in the creation of the asset.
Inspired on Bitcoin
Issued by Proof of Work.
Decreasing rate of production.
Scheduled halvings.
No governance
No ICO
No Fundrising
Differences with Bitcoin
Code is deployed, can't be changed
Tokens don't need their own blockchain
Implemented on Ethereum
Creation of 4 PoW cryptocurrencies
the halvings are 9 months separated
no need of own blockchain
Security, Decentralization.
Operating on Polygon
Cost of creation is good for establishing a price
Operation in ETH is very expensive
Polygon network solves the problem
new Opportunities of profit arise from arbitrage
Innovation
Scheduled halvings cause oscillations in relative price of the tokens.
Proof of Concept
The Relative price chart
Halvings
QR to proof of concept video
QR to relative price chart explained
DYOR QR to Article with links
Don't Trust, verify!!
Technical data sheet, with QR code to live data page
Ecosystem and Rewards
Overview of the system,
Ways of making profits in the system:
Mining,
Farming,
Trading,
Arbitrage,
participating in the promotion of the project.
How to Use Seasonal Tokens to get Bitcoin
Example use case like in the article.
QR to explainer video.

