Brochure
Brochure
BTC halving
Key observation in crypto: BTC halving introduces seasonality
A key observation in cryptocurrency is that the Bitcoin halving of mining supply every 210.000 blocks has introduced a periodic behavior in cryptocurrency markets.
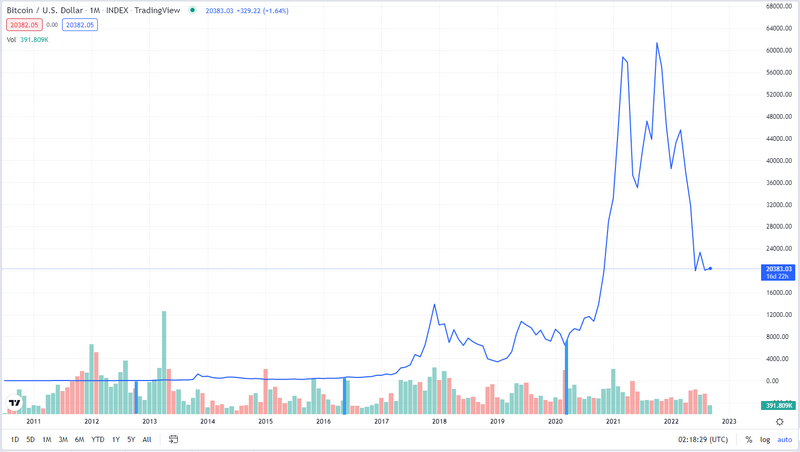
The following chart shows the historical Bitcoin's price. The blue vertical lines mark the dates when the mining supply of bitcoin was cut in half.
| date | Reward change in BTC |
|---|---|
| 11/28/2012 | 50 to 25 |
| 07/09/2016 | 25 to 12.5 |
| 05/11/2020 | 12.5 to 6.25 |
| 04/19/2024 | 6.25 to 3.125 |
As you can appreciate, there is nothing particularly enlightening about this graph. It is hard to see the effect of the halving of the mining supply. The price changes are so large that the information is lost in the details of price fluctuations.
Analysis of the Log(Price) chart. Bull and Bear markets.
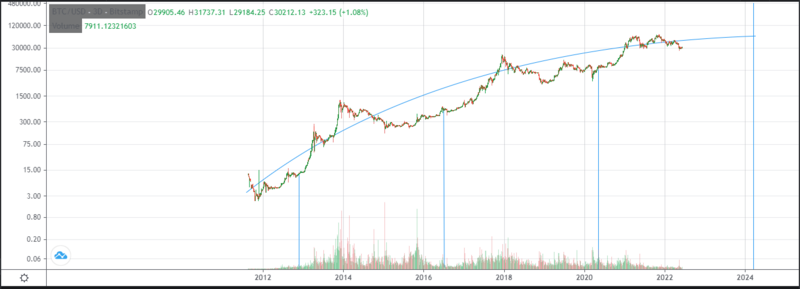
If we look at the graph on a logarithmic scale, we can concentrate on the order of magnitude changes, paying less attention to the random fluctuations in the price. Then a pattern emerges:
Every 4 years on average, the mining supply is cut in half. Months after the halving of the mining supply a bull market sends the Bitcoin price to all-time highs, this bull market sends the price way above its cost of production and the whole thing ends up with a price bubble leading to a bear market that may last for years until the next halving occurs.
As the Bitcoin price skyrockets, people starts looking for alternative investments leading to the so called "Altcoin Season", where other major cryptocurrencies experiment a rise in price due to the Bitcoin bull market.
Comment on Bull / Bear markets
The following information can go with the graph:
| date | BTC Price $ | Days after halving to Market Peak | Percent Gain | Days after peak to Market Bottom | Percent Loss |
|---|---|---|---|---|---|
| 11/28/2012 | 13 | 335d | 7323% | 638d | 80% |
| 07/09/2016 | 593 | 518d | 2190% | 396d | 76% |
| 05/11/2020 | 9265 | 518d | 557% | 426d | 74% |
| 04/19/2024 | 70000 | ? | ? | ? | ? |
QR with live chart for technical analysis
QR with link to live BTC chart

