Background
In construction...
Seasonal Tokens design is based on key observations about the way Bitcoin evolved over time. Therefore we need some understanding of Bitcoin to fully appreciate the design principles behind Seasonal Tokens. Check out this Bitcoin summary of ideas that influenced Seasonal Tokens design.
Basically, the mean feature borrowed from Bitcoin's design is the use of proof of work. In Bitcoin PoW is used in the consensus mechanism for keeping the distributed database. But it goes beyond that, in fact PoW solves many problems at once as described in the Bitcoin page.
Proof of Work mining is necessary for Seasonal Tokens design, because it gives a real cost of production for the tokens (together with ETH minting fees). This is what anchors the token's prices to the real economy, and it is the handle that allows the relative token's prices to oscillate around each other.
The halving of mining supply every 3 years in Seasonal Tokens (every 4 years in Bitcoin) also is a way to have an absolute maximum number of tokens produced.
The fact that there is a finite number of bitcoins is a necessary condition to make it so valuable. This digital asset is not subject to inflation. Nobody can produce Bitcoin out of thin air de-valuating the asset.
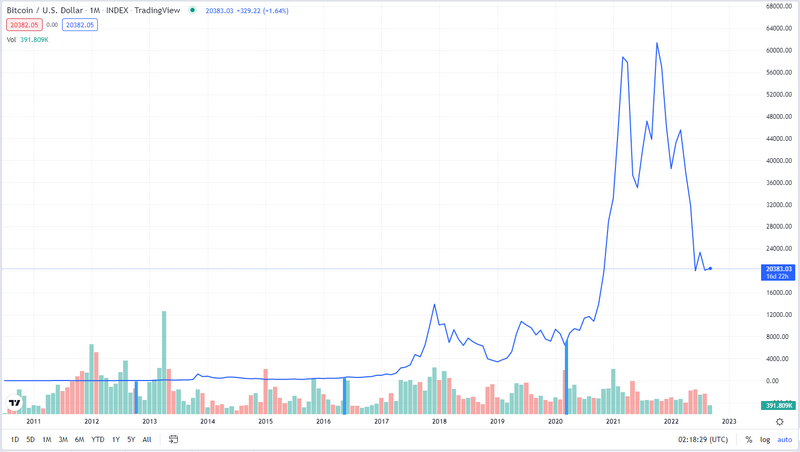
The key observation that led to the creation of Seasonal Tokens can be seen in the following chart. It shows the historical Bitcoin's price. The blue vertical lines mark the dates when the mining supply of bitcoin was cut in half.
As you can appreciate, there is nothing particularly enlightening about this graph. It is hard to see the effect of the halving of the mining supply. The price changes are so large that the information is lost in the details of price fluctuations.
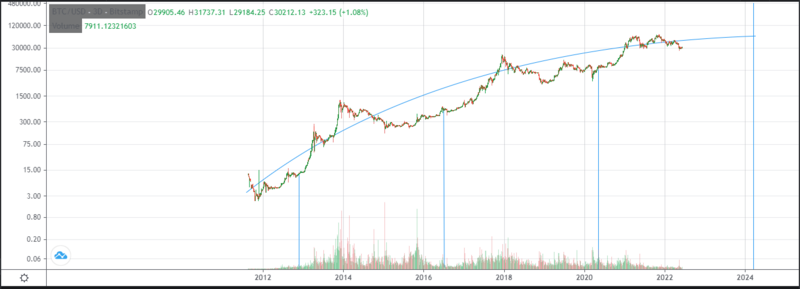
If we look at the graph on a logarithmic scale, it amounts to seeing the data through a filter that let us see only order of magnitude changes. Then a pattern emerges:


